Hot Rod Forum banner

Dyno sheet...

14K views 32 replies 8 participants last post by  1bad32  
#1 ·
Here's the dyno sheet for My 383sbc w/ 6-71 blower.
Crazzzzy hp for My '32 coupe.{almost 615 hp}
How do the #'s look?
 

Attachments

#9 · (Edited)
Sir??

Anyway, RPM is the far right vertical line marked "All Other Lines". The horizontal line across the bottom is "Run Time (Sec)" only.

Otherwise, using the bottom horizontal Run Time line (the only place I see where you could get your numbers from), it's making 430 HP/560 TQ at 0 RPM and the peak power would be at about 8700 RPM. The peak's stated to be at 6226 RPM...

MAIN point is, the lines do not cross at 5250.
 
#12 ·
cobalt327 said:
Sir??

Anyway, RPM is the far right vertical line marked "All Other Lines". The horizontal line across the bottom is "Run Time (Sec)" only.

Otherwise, using the bottom horizontal Run Time line (the only place I see where you could get your numbers from), it's making 430 HP/560 TQ at 0 RPM and the peak power would be at about 8700 RPM. The peak's stated to be at 6226 RPM...

MAIN point is, the lines do not cross at 5250.
You are correct! I was reading it like it was a normal graph with the RPMs across the bottom. Anyway, it's hokey.
 
#14 ·
WDCreech said:
You are correct! I was reading it like it was a normal graph with the RPMs across the bottom. Anyway, it's hokey.

So what do You want Me to ask the Guy Who I bought the engine from when I call Him Monday morning????
Let Me know "exactly" so He can give Me answers to Your negative feelings about His dyno sheet.
I bought it from Big Al's toy box,,,,do You think He's a scam artist???????
 
#15 ·
1bad32 said:
So what do You want Me to ask the Guy Who I bought the engine from when I call Him Monday morning????
Let Me know "exactly" so He can give Me answers to Your negative feelings about His dyno sheet.
I bought it from Big Al's toy box,,,,do You think He's a scam artist???????
It may be something that is easily explained, and I don't think he's necessarily scamming you, but the question I would have is:

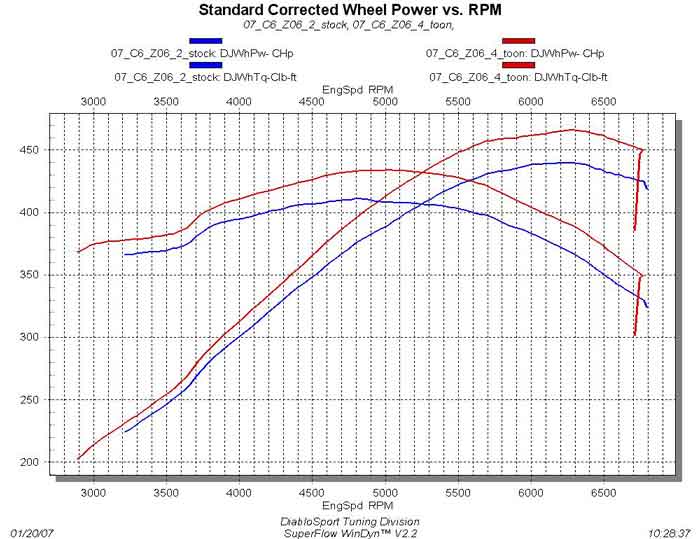
1. Why don't the torque and HP lines cross at 5250 RPM like every other dyno graph? (The formula for HP is TQ x HP divided by 5250. All this means is the lines cross at 5250 RPM)

2. Can a dyno sheet be supplied that has the power from the lowest RPM the engine will pull from, up to max power or redline, with the graph showing RPM across the bottom? (The lowest RPM is usually around 2000-3000 up to where the power falls off or the redline is reached)

EXAMPLES:

Image


Image


The printout can be configured in many different ways. The configurations in the examples above are the more common ones used (they both show TWO pulls on the same graph).

They show the full power curve with HP, TQ, and RPM. Simple and easy to read.
 
#19 ·
da34guy said:
Who cares, It'll never be able to hook up in a 2300 lb deuce,
unless that chassis it set up for it !!!!!!!!
That's a whole new subject.
He's buildin a street rod, not a race car.
Wasted $$$$, and H.P.
I know I darn sure would care. He paid for a dyno pull. Unless there's a good explanation why the graph is the way it is, he's owed another pull or his $$$ back IMO.

I'm curious if the same guys who did the dyno pull also built the engine... you know- conflict of interest and all that? Just sayin'.
 
#20 ·
I started looking at this a little closer as I got the feeling I should have said something earlier. I got 'snowed". Engineering experience didn't kick in soon enough. It happens when you get older. You just have to learn something new....how to recognize this before you make an "assumption" haha

The way this graph is laid out is way different than what we are used to

There are 3 lines one for HP, one for TQ and one for RPM The bottom line is EGT which for now we can ignore. It actually is ok I feel for this test.

The X axis is just the length of time the test was run...doesn't mean much to us. It is probably the way the load is programmed to load the motor so that it doesn' run unloaded at all.

Lets look at TQ. Starts out 560 or so goes up a little then drops down to 520 nearly dead flat.

HP starts out 430 goes up to 610 nice steady rise up to 6200 RPM.

RPM starts out 4000..here is the important part this is read from the right column y axis. The left is ok too but you have to multiply by 10 (factor of 10)
so we go up the RPM scale to 5250 read from the right. If you go across going right to left to the intersection of the HP and TQ line then vertically intersect the rpm line you will see the they cross right there at about 550

Ignore the x axis it has nothing to do with rpm!!! Follow the RPM line.

So the graph is really correct just presented poorly in our minds.

!Bad32. Just ask them to present the graph in terms that are normal to us. HP and TQ on the Y axis and RPM on the X axis. They can put EX gas on the Y axis too. We don't care about time.

Hope I explained this clearer than mud.

Alright, take me apart. :spank:
 
#22 ·
There is nothing wrong with this graph. HP and TQ do cross at 5252.

Since the bottom is time, look at the point where HP and TQ do cross. Circle it. Now drop a verticle line down through the RPM line. Now cirlce that point. Now go across to the right to find the RPM value. Guess what? 5252! I've shown this below. We are looking at one point in time. The point in time where HP and TQ cross. At that same point in time what is the RPM?

Image


/case closed
 
#26 ·
Landshark...that's what I tried to explain in my lengthy expose'. haha

Very deceiving chart. but the information is there. Pretty strong street motor. Wish it was mine.

I think it will run very well. It will need a 3000 converter and gearing to run about 26-2800 at 60 mph to be really comfortable.

Hopefully it has Holley carbs with metering plates with adjustable air bleeds.

I would definitely set the rear suspension up with a true 4 link and a heavy anti roll bar adjustable coil overs and some big Hoosier Pro Streets.